We looked at 5,599 owners in seven districts who sold a condo after holding it for at least three years. 99% sold for more than they paid. Unit size mattered most: three-bedroom and bigger units rose in price faster than one- and two-bedrooms. Homes bought at a higher psf than others nearby in the same year rose more slowly.
Some made a lot more than others, and much of that came down to when they bought. An owner who bought in 2020 caught the price rise that followed. An owner who bought in 2013 waited years for prices to move. So for each sale, we checked how much the whole market rose over the same years, and looked at who did better or worse than that.
The records cover condos, apartments and ECs in D16 (Bedok, Upper East Coast), D19 (Serangoon, Hougang, Sengkang, Punggol), D20 (Bishan, Ang Mo Kio, Thomson), D21 (Upper Bukit Timah, Clementi Park), D22 (Jurong, Boon Lay), D23 (Bukit Panjang, Choa Chu Kang, Hillview) and D28 (Seletar, Yio Chu Kang).
Most homes grew slower than the market index
The typical owner's price rose 4.3% a year. URA's price index for condos outside the central region rose 6.1% a year over the same periods. Only 26% of owners beat it.
Falling behind the index is normal for a resale. The index includes brand-new homes, sold at new-launch prices. A resale home gets older every year, so it tends to lag. That's why the rest of this article compares homes with each other, rather than with the index.
What made a difference
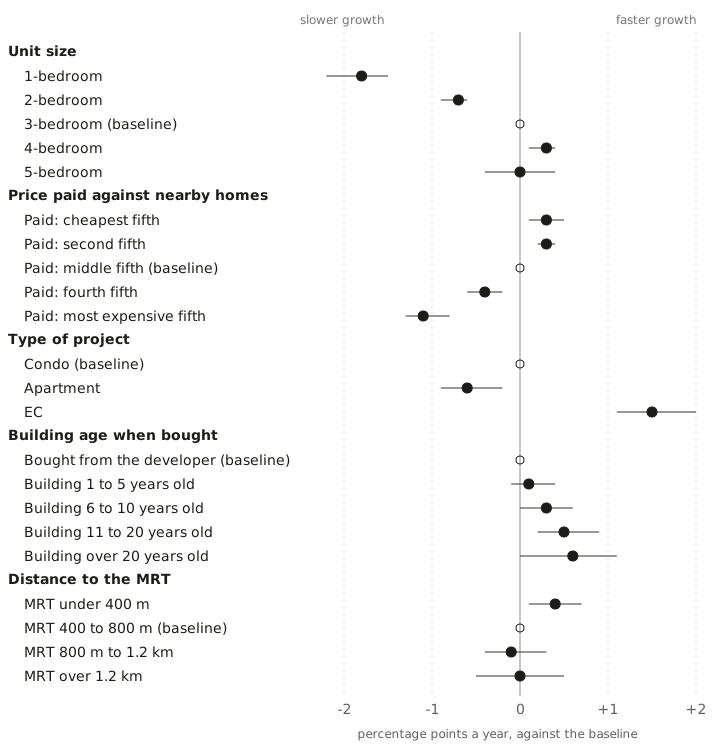
Each dot in the chart compares homes that were the same in everything else we could measure, such as district and year bought, and differed in one thing. A dot at −1 means those homes grew one percentage point a year slower than the baseline. The grey line is the likely range. If it crosses zero, there may be no real difference.
Unit size
Size mattered most. Compared with a three-bedroom in the same district, bought in the same year, a one-bedroom grew 1.8 points a year slower. A two-bedroom grew 0.7 points slower. A four-bedroom grew 0.3 points faster.
| Bedrooms | Owners | Median growth a year | Beat the market |
|---|---|---|---|
| 1 | 706 | 2.3% | 2% |
| 2 | 1,661 | 3.7% | 11% |
| 3 | 2,575 | 5.1% | 38% |
| 4 | 584 | 5.4% | 44% |
| 5 | 73 | 5.7% | 42% |
Paying more than nearby homes
We compared each purchase's price per square foot with other purchases in the same district in the same year, and split them into five equal groups. Owners in the most expensive group grew 1.1 points a year slower than the middle group. Owners in the two cheapest groups grew 0.3 points faster.
It's the same for three-bedrooms on their own:
| Three-bedrooms, price paid | Owners | Median growth a year | Beat the market |
|---|---|---|---|
| Cheapest fifth | 757 | 5.6% | 49% |
| Second fifth | 602 | 5.7% | 50% |
| Middle fifth | 539 | 5.0% | 34% |
| Fourth fifth | 390 | 4.4% | 23% |
| Most expensive fifth | 287 | 3.5% | 13% |
A higher price per square foot can be fair, since a newer building, a high floor or a good view costs more. Still, owners who paid near the top for their area saw less growth afterwards.
ECs
ECs grew 1.5 points a year faster than condos. Most of that went to the first owners, who bought from the developer.
| EC owners | Owners | Median growth a year against the market | Beat the market |
|---|---|---|---|
| First owners, bought from the developer | 609 | +1.1 points | 89% |
| Bought resale | 352 | +0.1 points | 52% |
First owners bought below condo prices and watched EC prices catch up. ECs now sell much closer to condo prices, so a buyer today may not get the same.
Apartments
Apartments are usually smaller developments with fewer facilities. They grew 0.6 points a year slower than condos.
The building's age when you buy
Owners who bought into a building 11 to 20 years old grew 0.5 points a year faster than owners who bought from the developer. Buying in the first five years made little difference.
Our guess is that a new home's price includes something extra for being new, and that wears off in the first years.
Distance to the MRT
Homes under 400 m from a station grew 0.4 points a year faster than homes 400 to 800 m away. Further out, distance made no clear difference.
If you look only at the raw numbers, homes more than 1.2 km away seem to do best, with 46% beating the market. Those are mostly ECs, which in these districts tend to be far from a station. Among condos alone, being far away didn't help.
District
After allowing for everything above, D19, D20 and D28 did about the same. D16 grew 1.0 point a year slower than D19, D21 0.8 points slower, D23 0.7 and D22 0.6.
| District | Owners | Median growth a year | Beat the market |
|---|---|---|---|
| D16 | 690 | 3.6% | 8% |
| D19 | 1,894 | 4.8% | 37% |
| D20 | 1,260 | 4.7% | 26% |
| D21 | 365 | 3.6% | 19% |
| D22 | 336 | 4.3% | 21% |
| D23 | 772 | 3.8% | 24% |
| D28 | 282 | 4.4% | 26% |
Within each district, some projects grew much faster than others, so check the project's own past sales too.
What didn't matter much
- Freehold or 99-year lease. Freehold homes grew 0.2 points a year faster, too small to be sure it's real.
- How long the owner held. Owners who held longer didn't see faster growth each year.
- How big the project is. Large and small projects grew about the same.
In short
- Bigger units grew faster. Over a third of three- and four-bedroom owners beat the market, against about one in ten two-bedroom owners.
- Owners who paid near the top of the price range for their district and year saw the least growth afterwards.
- Homes within about 400 m of an MRT station grew a little faster than those further away.
- Older buildings didn't grow slower. Owners who bought into a building 11 to 20 years old did slightly better than first owners.
URA's transaction search lists past sales by project, and OneMap shows the walk to the nearest station.
How we did it
We used URA caveat records for D16, D19, D20, D21, D22, D23 and D28, from ERA's transaction export on 16 Nov 2026. We kept resales of condos, apartments and ECs with one to five bedrooms, held for at least 3 years. That's 5,599 owners in 369 projects, who bought between 1995 and 2023 and sold between 2023 and 2026.
For each sale, we took URA's price index for condos outside the central region in the quarter the owner bought and the quarter they sold. The owner's growth a year minus the index's growth a year tells us how far ahead of or behind the market they were.
We then compared all the features at once, in one regression: district, year bought, type of project, bedrooms, price group, building age when bought, distance to the MRT, freehold, project size and how long held. Homes in the same project tend to rise and fall together, and we allowed for that in the ranges on the chart. Together, these features explain 59% of the difference between owners.
A few things to keep in mind when reading the numbers:
- We only have owners who have sold. Owners who bought at the same time and haven't sold may have done better or worse.
- ERA's export stops at 2,000 rows. For D19, D21, D22, D23 and D28, that only reaches back to between August and November 2025. For D16 and D20 it reaches back to 2023. We reran the numbers on the last 12 months only, which every district has, and the figures for unit size, price paid and district changed by 0.1 points a year at most.
- We measured distance to the MRT in a straight line to today's stations. The actual walk is longer, and some stations opened after the owner bought.
- The records don't include floor, facing, view or the unit's condition. Part of the gap between cheaper and more expensive purchases may come from these.
This looks at past sales. It doesn't predict future prices and isn't financial advice.
Want help with your search?
Tell us your districts, size and budget. We'll go through recent sales for the projects on your list with you, and what owners there made when they sold.
Records from URA caveats, run on 16 Nov 2026.